


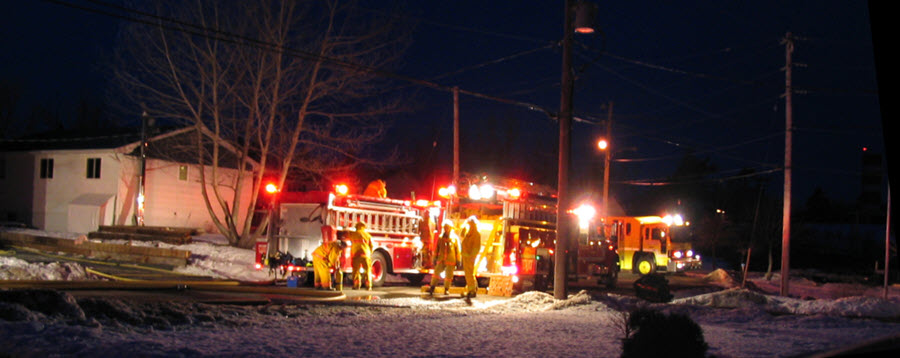
NFPA Reports 59,000 Firefighter Injuries in 2017
The NFPA estimates that on-duty firefighters suffered 58,835 injuries in 2017, a decrease of five percent from the previous year – and the lowest number since NFPA began analyzing this data in 1981. Of these firefighter injuries, 10,155 (17 percent) resulted in lost time from work, according to an article in the November-December NFPA Journal.
The NFPA estimates the injury numbers based on its 2017 fire experience survey of 2,592 public fire departments. A summary report also concludes there were 7,345 exposures to infectious diseases such as hepatitis, meningitis and HIV in 2017. This amounts to 0.3 exposures per 1,000 emergency medical service runs by fire departments in 2017.
In addition, survey results predict some 44,530 exposures to hazardous conditions such as asbestos, radioactive materials, chemicals and fumes last year. The increase in these types of exposures in recent years could be a result of improved reporting due to heightened awareness about cancer and other chronic illnesses in the fire service.
A summary report of the study includes estimates of the number of injuries by type of duty, the number of exposures to infectious diseases, trends in firefighter injuries and rates, fireground injuries by cause, fire department vehicle accidents and resulting firefighter injuries, the average number of fires and fireground injuries per department by population of community protected, and descriptions of selected incidents that illustrate firefighter safety problems.
The number of injuries has dropped considerably from the 1980s and 1990s, due in part to additional survey questions on exposures to hazardous conditions and infectious diseases, which are now their own categories. Previously, some of these exposures might have been included in total injuries under other categories.
Injuries by Type of Duty
Firefighters were more likely to be injured at fireground operations than at other types of duties. In 2017, 24,495 injuries (42 percent) occurred at the fireground. This was a slight increase over the previous year. Injuries at the fireground decreased from a high of 67,500 in 1981 to 24,495 in 2017, a drop of 64 percent. The number of fires also declined steadily, for an overall decrease of 54 percent. The rate of injuries per 1,000 fires over the past 35 years has fluctuated between a high of 28.3 injuries per 1,000 fires in 1990 and a low of 18.1 injuries per 1,000 fires in 2016.
Overall, the number of injuries at non-fire emergencies increased 28 percent between 1981 and 2017, from 9,600 to 12,240. During the same period, the number of non-fire emergencies also increased 332 percent, due in large part to an increase in the number of fire department responses to medical emergencies. The injury rate per 1,000 non-fire emergencies declined between 1981 and 2017, from 1.2 to 0.4, largely because the number of non-fire emergencies increased at a higher rate than the number of injuries at non-fire responses.
In addition, 4,555 firefighter injuries occurred in 2017 while responding to or returning from an incident. Another 8,380 firefighter injuries occurred during training activities, and 9,165 injuries occurred during other on-duty activities.
Nature and Cause of Firefighter Injuries
The major types of injuries suffered during fireground operations were:
- Strains and sprains, 48 percent
- Wounds, cuts, bleeding and bruises, 15 percent
- Smoke or gas inhalation, 7 percent
- Thermal stress (frostbite or heat exhaustion), 5 percent.
Overexertion or strain was the leading cause of fireground injuries, accounting for 29 percent of the total. Falls, jumps or slips accounted for 20 percent, and exposure to fire products accounted for 11 percent.
Fire Department Vehicle Collisions
NFPA reported previously that 18 firefighters died in vehicle-related incidents in 2017, including 10 who were struck by vehicles and eight who died in vehicle crashes. Ten is an unusually high number for firefighters struck by vehicles, as the average for the previous 30 years is four per year.
In 2017, an estimated 15,430 collisions involved fire department emergency vehicles responding to or returning from incidents – similar to 2016 numbers. Although the number of collisions represents just 0.04 percent of total responses, these collisions resulted in 2 percent of all firefighter injuries.
Another 795 collisions involved firefighters’ personal vehicles, in which they were responding to or returning from incidents. These collisions resulted in an estimated 75 injuries.